https://rss.laro.dev/aemet/mapa-isobaras.xml
RSS feed with the isobar map over Spain.
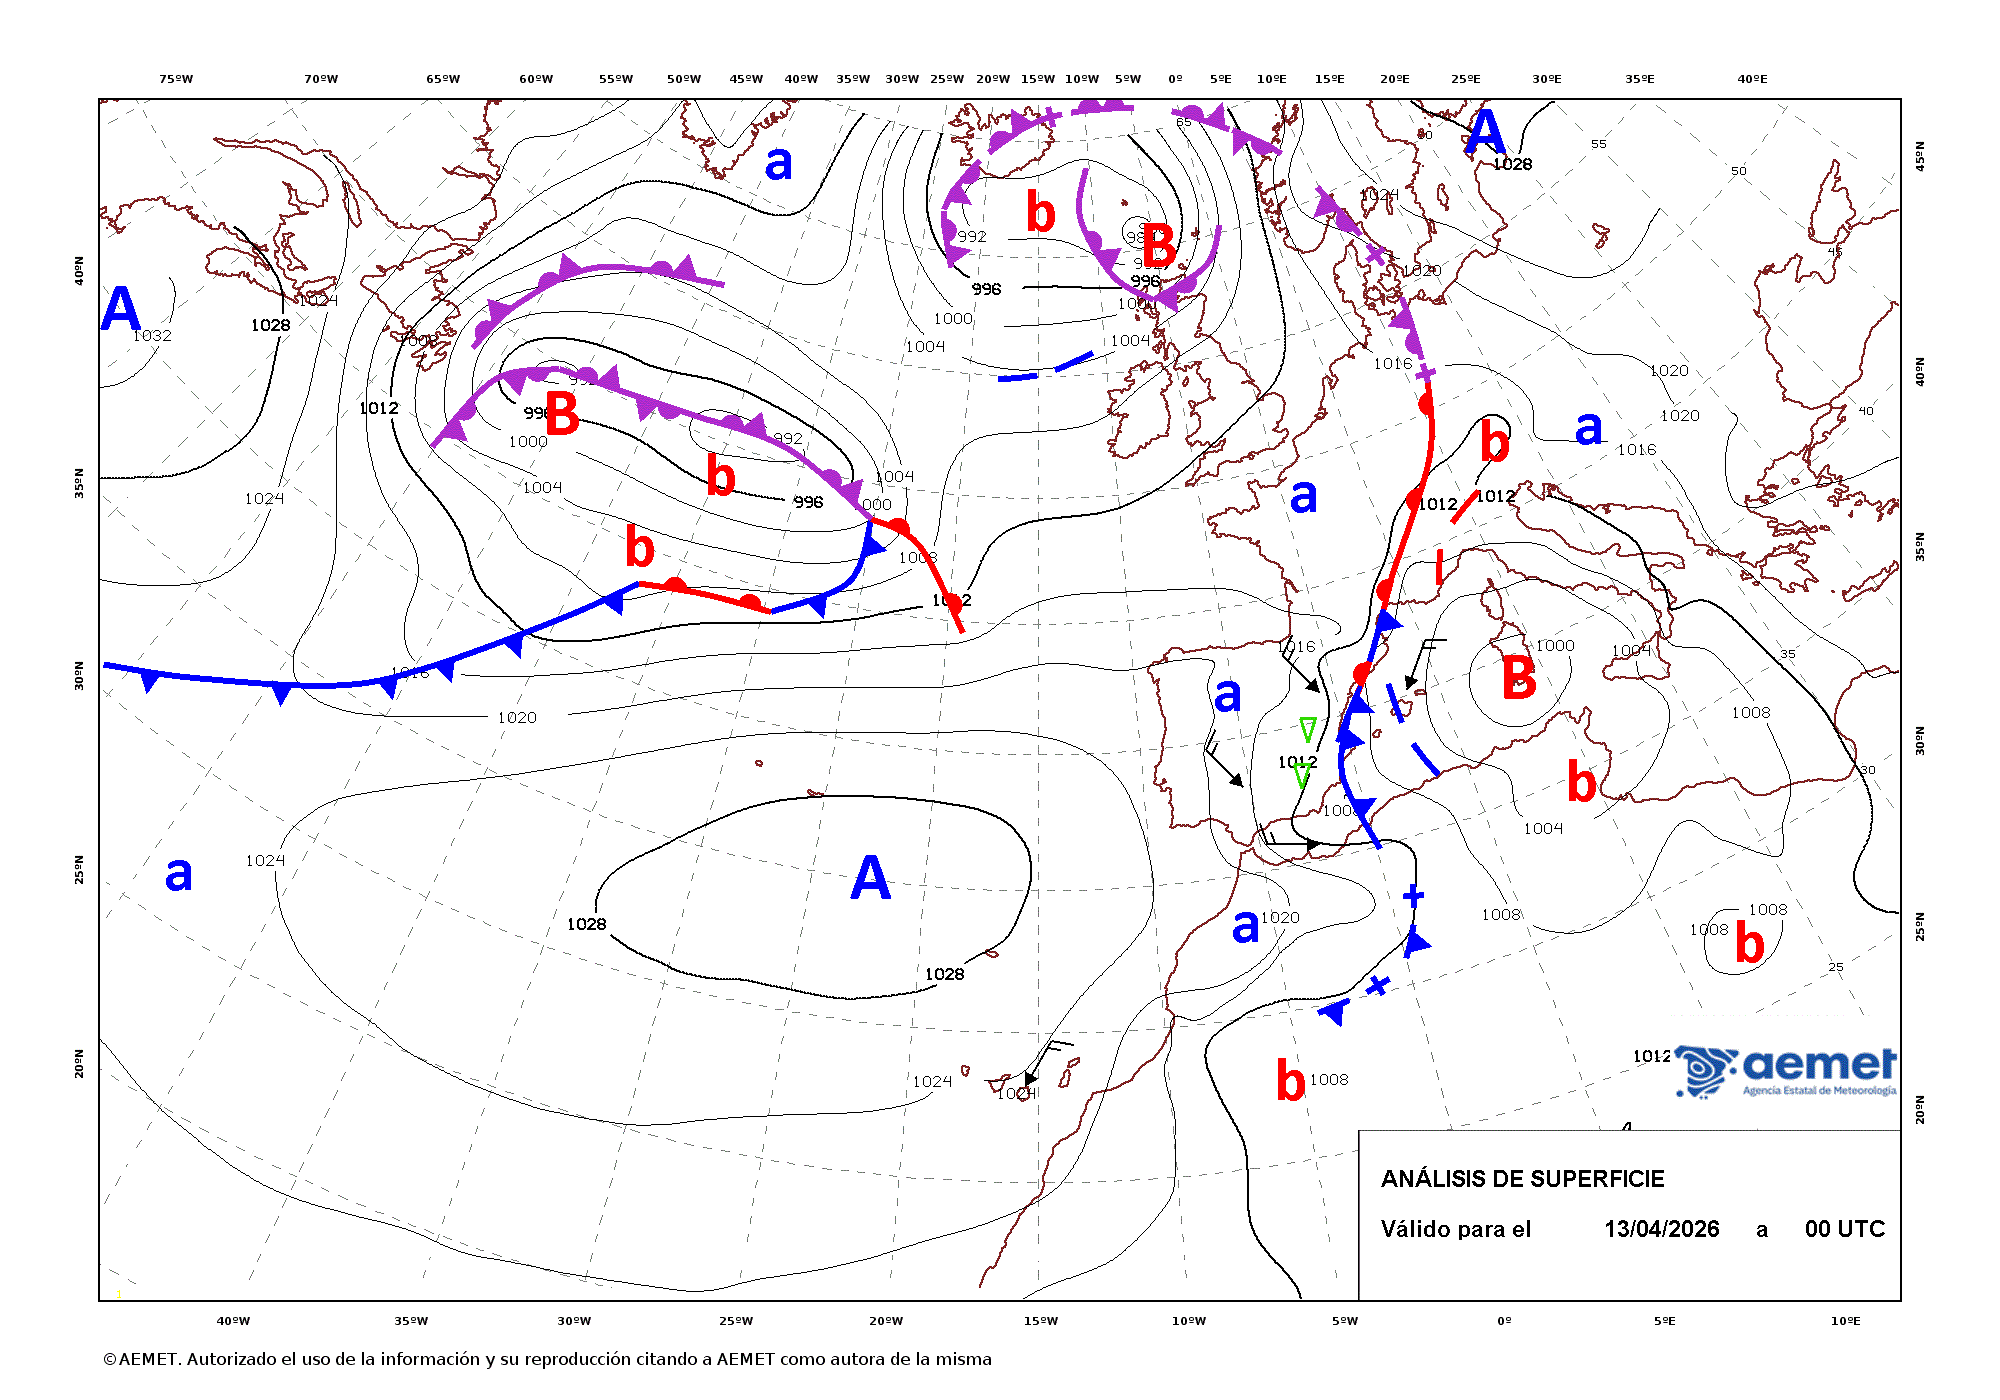
These maps show the surface pressure configuration using isobars (lines of equal pressure), high (A, a) and low (B, b) pressure areas, and fronts over Europe and the North Atlantic.
The analysis map presents the state of the atmosphere at the corresponding time and the most relevant phenomena observed in Spain. Update frequency: every 12 hours (00, 12).
Image obtained from AEMET through its API.